Between the rebranding and the emergence of new competitors, X (Twitter) may have lost a few users in the past years. But despite the volatility, it resiliently remains a key hub for real-time engagement and customer service. From news and sports to pop culture and political discourse, X is where it’s still at. The latest social media stats also show that 58% of the platform’s users engage with brand content every week. And if X is still a mainstay in your brand’s marketing strategy, you need to know what’s going on in the platform. That’s why we put together these 27 X (Twitter) stats to help you do just that. Key X (Twitter) statistics at a glance
Metric Value
Potential ad reach 557 million
Daily active users 251 million
World usage ranking 15th
Top demographic Men aged 25 to 34 years
Top country United States
Top content format Short-form video
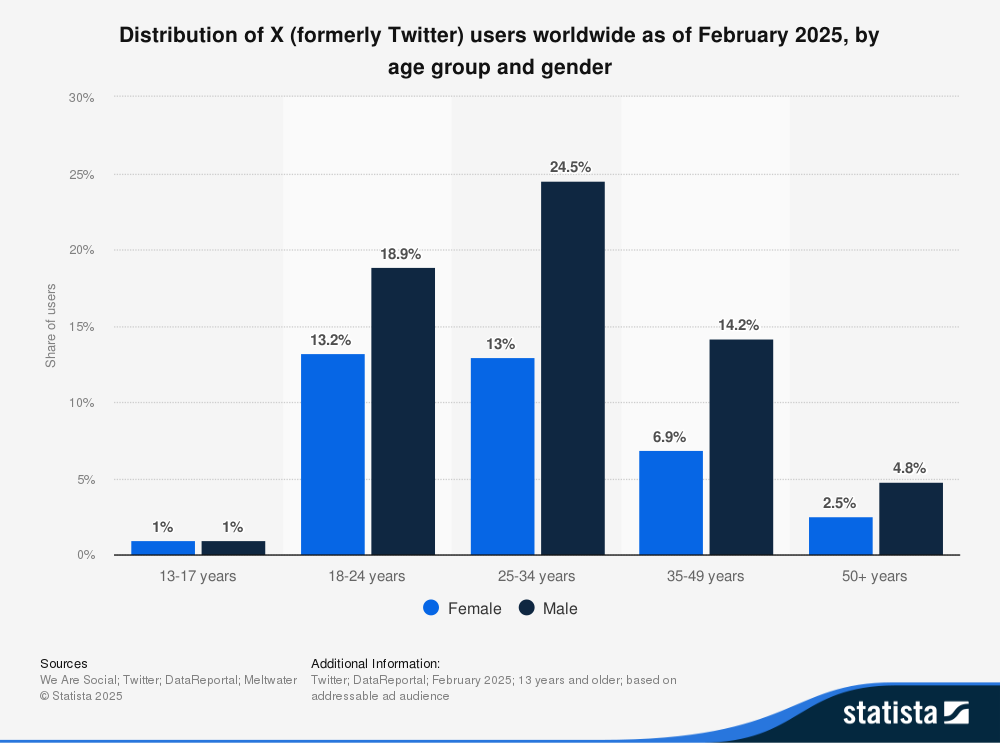
Although there’s no publicly available data on X’s monthly active users (MAU), it’s estimated to have a potential ad reach of 557 million. This makes it the 15th most popular social network compared with the MAU of other platforms. Almost half of these users are active on the platform daily, with recent reports estimating 251 million daily active users. So people are still very much active on X in spite of the algorithm and leadership changes. X is also one of the social platforms where users heavily sway male, with the top demographic being men aged 25 to 34 years. And with most X users being located in the United States, it could be an effective platform for brands wanting to reach this demographic. X (Twitter) user statistics and demographics to help reach your audience So who’s really using X? And is your audience on the platform? Let’s look at a more detailed breakdown of X (Twitter) statistics to see if it’s the right fit for you. 1. One-third of social media users have an X account According to the 2026 Social Media Content Strategy Report from Sprout Social, about one in three social media users has an account on X. This speaks for the popularity of the platform among active social media users. 2. Gen Z represents the largest audience on X And X’s popularity among younger users continues to grow over the years. The Social Media Content Strategy Report found that Gen Z consumers are most likely to have a profile on X. 3. The largest age group on X is 25 to 34 years More specifically, users between the ages of 25 and 34 make up the largest age group (37.5%). The second largest age group is 18 to 24 years (32.1%), followed by 35 to 49 years (21.1%).
Source: Statista 4. Male-identifying users dominate X X limits its reporting to male and female. And the data shows that male users make up 64.4% of the platform’s audience. The “gender gap” is much wider than on other platforms like Instagram, which has 52.5% male users based on the latest social media demographics data. So it’s a great place to build your brand presence if you’re marketing to these demographics. 5. The United States has the most X users The good news for brands targeting the US market is that US audiences dominate the platform. Over 99 million X users are based in the United States. Other top countries by user count are:
Japan (71.19 million) Indonesia (22.92 million) India (22.17 million) United Kingdom (18.96 million)
Source: Statista (Pro tip: Use Twitter (X) analytics tools to track your brand’s Twitter follower stats and audience demographics.) X (Twitter) usage and behavior statistics Your target audience may be on X, but it’s important to understand how exactly they’re using the platform. How much time are they spending on the platform? Are they reading the news or seeking out customer service? Let’s take a look at the key X (Twitter) usage stats. 6. Each user spends almost half an hour per day on X According to the Digital 2026 Global Overview Report from Datareportal, each user is spending about 28 minutes per day on X. That’s more time spent than on other platforms like Reddit, Snapchat, Discord and Pinterest. Although users are spending significantly more time on TikTok and Instagram, you can see that X users are still staying on the platform long enough to engage with brands. 7. X is the top platform for getting news X remains the most popular platform for news and breaking events. According to the Digital 2026 Global Overview Report, nearly 60% of users use the platform to stay on top of news and current events. Socreating timely content and engaging in trending conversations could help brands establish a strong presence on X. Meanwhile, following or researching brands and products was the second most popular activity (38.1%). And 35.7% of users were looking for funny or entertaining content.
Source: DataReportal 8. Entertainment is the top reason for interacting with brands on X With that said, when interacting with brands, X users are mostly seeking out entertainment. The 2026 Social Media Content Strategy Report found that entertainment was the top reason for brand interaction, followed by customer care. This means you should be creating more entertaining content to engage your audience on X. And social media customer service should be central to your brand presence on the platform. X (Twitter) engagement statistics Before committing to using X, brands should also look at what engagement is like on the platform. What’s the average X (Twitter) engagement like? And which industries see higher engagement? 9. Average number of weekly posts on X has increased Based on Statista reports, X users are posting more on the platform. The average number of weekly posts jumped from 15.97 in 2024 to 17.34 in 2025. This is another good indicator of just how active the platform’s user base is.
Source: Statista 10. X posts are seeing fewer impressions but more engagements Although users are posting more, impressions have declined slightly between 2024 and 2025. While X posts were seeing an average of 2,864.78 impressions in 2024, the number dropped to 2,711.29 in 2025. But the good news is that those impressions have a bigger impact now as engagements see an uptick. The average engagement on X posts increased across every type of interaction between 2024 and 2025. Likes were the most popular interaction, with posts getting an average of 32.89 Likes, 6.67 Retweets and 2.56 replies.
Source: Statista 11. Engagement peaks from Tuesdays through Thursdays According to Sprout’s study on the best times to post on Twitter, brands see the most engagement on Tuesdays, Wednesdays and Thursdays. As for timing, 10 a.m. to 5 p.m. tend to be the most engaging hours. But this may vary depending on the day of the week. When in doubt, use your analytics to understand the best time to post on Twitter (X) for your business.
12. Users are more likely to engage with short-form video than text-based posts When it comes to the content formats that users like to engage with, short-form video has finally surpassed text-based posts on X. According to the 2026 Social Media Content Strategy Report, 37% of users are most likely to interact with short-form video from brands. Text-based posts come at a close second, with 36% preferring to interact with them. So it makes sense to include different formats in your social media content strategy for X.
13. Sports teams see the highest engagement on X As for the industries that get the most engagement on X, there’s a clear winner. Sports teams see a median engagement rate per post of 0.073%, while the median rate is 0.015%. This makes sense as X is where people go to stay on top of current events. So they could be engaging with sports teams during live gaming events or for post-game highlights. Interestingly, media accounts didn’t see as much engagement, although they’re posting the most at a median of 49.90 posts per week. Other top-performing industries are:
Higher education (0.036%) Financial services (0.025%) Nonprofits (0.023%)
Source: RivalIQ X (Twitter) advertising and marketing statistics Seeing how X still sees plenty of engagement, brands will also want to look at how users will interact with their ads and marketing efforts. Here are some key stats to inform your X (Twitter) marketing strategy. 14. More than half of X users interact with brand content weekly Users on X are still actively interacting with brands on the platform. As Sprout’s 2026 Social Media Content Strategy Report found, 58% of users interact with brand content at least once a week. So it makes sense for brands to build their presence on the platform. 15. X users are 45% more likely to click on a social media ad According to X’s internal data, users on the platform are 45% more likely to click on an ad on a social network. Advertisers could effectively use X to get their brands or products in front of the right audience and drive clicks. 16. X users are 76% more likely to be the first to try new things X also reports thatusers on the platform are 76% more likely to be the first to try new things compared to other consumers. And this likely explains why they’re also more inclined to click on those ads. 17. Promoted posts on X cost between $0.26 and $1.50 X offers some of the most cost-effective advertising solutions. A WebFX survey found that promoted X posts cost about $0.26 to $1.50 per first action, with 54% of businesses spending this amount. This allows most businesses to keep their ad spend low. About 50% of businesses spend between $101 and $500 per month on X advertising. 18. Customer support is the #2 effort consumers want from brands on X According to the 2026 Social Media Content Strategy Report, customer support is the #2 effort consumers want brands to prioritize on X. And for 18% of social media users, the platform is a top destination for customer service. 19. 1 in 3 users made a purchase after a positive customer experience on X And ramping up your customer service efforts on X pays off in the long run. Sprout’s data on Twitter customer service shows that a positive customer experience on X influences buying decisions. About 1 in 3 users, or 34% of survey respondents, bought a product or service after a positive experience on X. 20. Brands typically respond in 1 hour or less So what counts as a positive customer service experience on X? Quick responses are a great place to start. Based on the Twitter customer service data from Sprout, 36% of users get a response from a brand in less than an hour. Keeping your response times within this limit will help you keep up with other brands on the network. X (Twitter) video statistics As the earlier data from Sprout shows, X users are showing a preference for video. And the format is a major focus for the X algorithm in 2026. Here are some key stats on how video is performing on X. 21. Users prefer videos shorter than 60 seconds The 2026 Social Media Content Strategy Report already established that 37% of users are most likely to interact with short-form video on X. And the shorter, the better. A closer look shows that videos shorter than 60 seconds perform best on the platform. 22. Over 4 out of 5 user sessions include video X users are also watching a lot more video on the platform than they did before. The company’s internal data shows that more than four out of five user sessions include video. And there’s a 35% year-over-year increase in video views. 23. Vertical videos are on the rise More specifically, vertical video is seeing increased adoption. X reports that over 100 million people watch vertical video on the platform. And it accounts for 20% of all time spent on X. So brands should be creating short, vertical videos akin to Reels and TikToks to engage users on X.
Source: X X (Twitter) influencer statistics Instagram and TikTok may dominate the influencer marketing space, but X still has its place. As brands continue to explore influencer marketing strategies, understanding how X influencers perform compared to those on other platforms is crucial for social media managers and digital marketing professionals. Below, we break down key metrics to help you make informed decisions about leveraging X influencers in your campaigns. 24. 21% of X users are most likely to interact with influencer content Sprout’s 2026 Social Media Content Strategy Report found that people are still actively engaging with influencers on X. 21% of users are most likely to interact with influencer content on the platform. Among these users, younger consumers (especially Millennials) tend to show a preference for influencer content. 25. Engagement rate for Twitter (X) influencers has increased Engagement rate is one of the most critical factors in determining an influencer’s effectiveness. When looking at X influencer data pulled directly from our Sprout Social Influencer Marketing dashboard, the average engagement rate per post from an X influencer in 2025 was 0.39%. This is a significant increase from the previous year’s rate of 0.09%.
Photo posts had an engagement rate of 0.41%. Video posts performed significantly better, with an engagement rate of 0.41%. Text posts saw a slightly higher engagement rate at 0.48%. Link posts had a significantly lower engagement rate at 0.13%.
Although video content on X generally performs better across the platform, text posts from influencers see higher engagement compared to other formats. So the most strategic move is to mix things upbetween different formats if you’re looking to maximize engagement. 26. Influencer partnerships on Twitter (X) are cost-effective Cost-effectiveness is another crucial factor in influencer marketing, and X influencers tend to be on the lower end of the influencer pricing spectrum compared to platforms like Instagram or YouTube. Based on our data from Sprout Social Influencer Marketing, here’s the breakdown of average costs per post on X:
Nano-influencers: $11 Micro-influencers: $60 Mid-tier influencers: $550 Macro-influencers: $1,500 Mega-influencers: $11,000 Celebrities: $22,000
For brands with a limited budget, X provides an opportunity to work with influencers at a lower cost while still reaching engaged audiences—particularly through video content. 27. The US and UK are the top-performing markets for Twitter (X) influencer engagement For marketers targeting international audiences, understanding engagement distribution by country is essential. According to Sprout Social Influencer Marketing data, the United States led X influencer engagement in 2024 with 41.5 billion engagements, followed by:
UK: 7.51 billion engagements Brazil: 5.52 billion engagements Canada: 3.32 billion engagements Kenya: 3.09 billion engagements
This shows us that X influencer engagement is most significant in the US and the UK, making them key markets for brands looking to leverage influencer marketing on the platform. We recommend considering partnerships with X influencers native to these countries if your target international audience is among them. Choosing influencers that are local to your audience has a much greater impact on engagement than if they’re from an area different than your audience. What to do next with these Twitter marketing statistics X’s popularity and usage may have dropped over the past few years. But these key X stats show that the platform still plays a vital role in social media marketing. Even in the midst of the platform’s evolution, you can find stability and success if you ground your strategy in data. This means adjusting your content mix to focus more on short-form video. It means entertaining your audiences and solving their problems with timely responses. And it also means working with relevant X influencers to lead conversations around your brand. Using a reliable tool for social media analysis is essential for staying on top of these shifting trends. That’s where Sprout’s X (Twitter) analytics tools come in, helping you track how your posts and topics are performing. You can get a comprehensive look into your Twitter account stats and see which posts get the most engagement and which topics are trending. Ready to measure your X performance against these benchmarks? Start your free trial of Sprout Social today. The post 27 Twitter (X) stats to know in marketing in 2026 appeared first on Sprout Social.